Rivers: from rainfall to flood decisions
Follow water through a catchment, interpret a storm hydrograph and evaluate flood management.
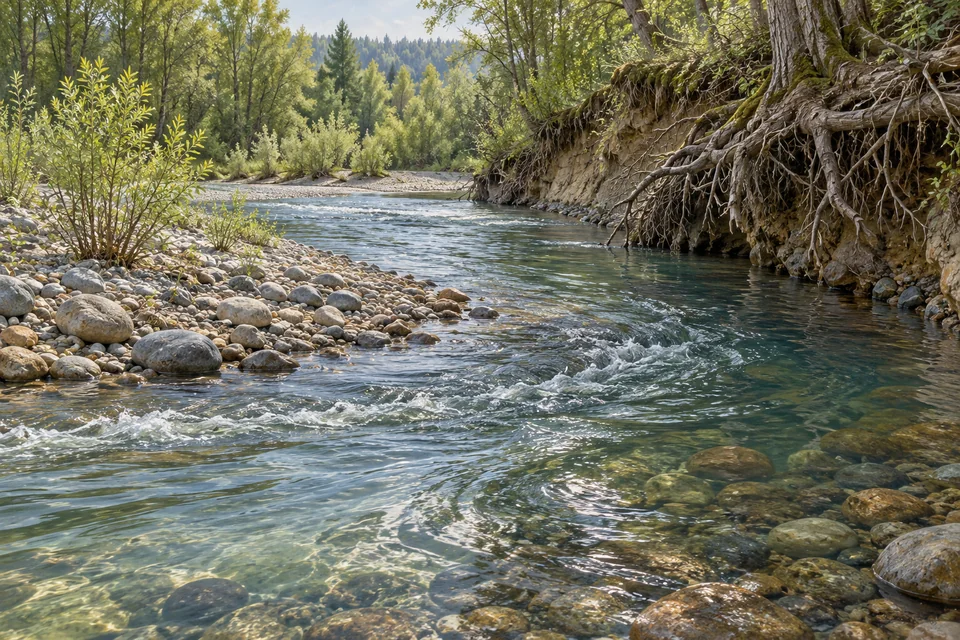
Follow the water
A drainage basin is the area drained by a river and its tributaries. Its watershed divides it from neighbouring basins. Rainfall supplies water; interception, soil and groundwater store some of it. Water leaves through river flow and evapotranspiration.
Infiltration moves water into soil. Surface runoff travels over the land. Impermeable surfaces reduce the area available for infiltration; drainage can deliver water rapidly to a channel. Initial soil wetness and rainfall intensity also matter.
Worked example
A fictional 2 km² catchment receives 20 mm of rain. Convert 20 mm to 0.020 m and 2 km² to 2,000,000 m². Rainfall volume = 0.020 × 2,000,000 = 40,000 m³. This is rainfall input, not river discharge: some water is stored or leaves by other routes.
Common mistake: Rainfall depth is not discharge. Discharge is a volume per second, and its timing depends on the catchment.
Read the storm response
A hydrograph plots discharge over time. Find the rainfall peak and discharge peak before measuring lag time. Use the time axis, not the apparent distance between the peaks.
A higher, earlier discharge peak can indicate faster delivery of storm water. One hydrograph cannot isolate the cause: compare rainfall, catchment size and initial conditions.
Worked example
Rainfall peaks at hour 3; discharge peaks at hour 8. Lag time = 8 − 3 = 5 hours. If discharge rises from 4 to 16 m³/s, the increase is 12 m³/s and the percentage increase is 12 ÷ 4 × 100 = 300%.
Common mistake: A discharge of 16 m³/s is 400% of 4 m³/s, but the increase is 300%.
Choose and evaluate management
Storage, leaky barriers and floodplain space can delay runoff. Defences can reduce local exposure. Warnings and preparedness help people respond. Each approach has a different geographical reach and residual risk.
Evaluate performance against the event being managed, who benefits and what happens beyond the protected area. A defence can be overtopped; storage can fill.
Worked example
A fictional channel receives 60,000 m³ over two hours: average flow is 60,000 ÷ 7,200 = 8.33 m³/s. Spreading the same volume over four hours gives 4.17 m³/s. These averages illustrate timing; they do not calculate the actual peak of a flood.
Common mistake: A lower average does not by itself establish a lower peak. The full flow distribution matters.
Try a fresh resource
River hydrographs
Blue bars show rainfall in the hour ending at each labelled time. The green line shows discharge at that time. Peak lag is the difference between the hours of maximum rainfall and maximum discharge.
| Hour | Rainfall in preceding hour (mm) | Discharge (m³/s) |
|---|---|---|
| 0 | 0 | 5 |
| 1 | 4 | 5 |
| 2 | 11 | 5 |
| 3 | 6 | 5 |
| 4 | 0 | 7 |
| 5 | 0 | 13 |
| 6 | 0 | 19 |
| 7 | 0 | 13 |
| 8 | 0 | 7 |
| 9 | 0 | 5 |
| 10 | 0 | 5 |
| 11 | 0 | 5 |
| 12 | 0 | 5 |
On a small screen, scroll the diagram sideways to see the full resource.
Resource description
Hour 0: 0 mm rainfall, 5 m³/s discharge; Hour 1: 4 mm rainfall, 5 m³/s discharge; Hour 2: 11 mm rainfall, 5 m³/s discharge; Hour 3: 6 mm rainfall, 5 m³/s discharge; Hour 4: 0 mm rainfall, 7 m³/s discharge; Hour 5: 0 mm rainfall, 13 m³/s discharge; Hour 6: 0 mm rainfall, 19 m³/s discharge; Hour 7: 0 mm rainfall, 13 m³/s discharge; Hour 8: 0 mm rainfall, 7 m³/s discharge; Hour 9: 0 mm rainfall, 5 m³/s discharge; Hour 10: 0 mm rainfall, 5 m³/s discharge; Hour 11: 0 mm rainfall, 5 m³/s discharge; Hour 12: 0 mm rainfall, 5 m³/s discharge
Explore the process
Use sourced case evidence
- Slowing the flow at Pickering
- Somerset flooding, 2013–14
Slowing the flow at Pickering · Somerset flooding, 2013–14
Read further
Primary-source explanation · drainage basin · flood management