Regeneration: success for whom and compared with what?
Evaluate objectives, counterfactual evidence, displacement and contested success in urban and rural places.
A-level study: check your qualification and chosen options below.
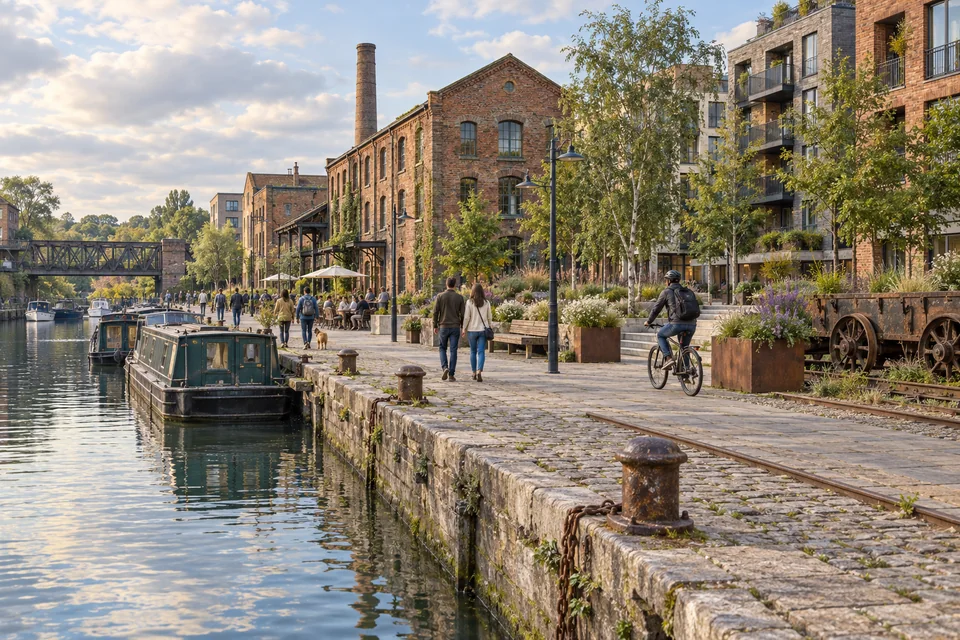
Turn objectives into criteria
Regeneration attempts to change economic, social or environmental conditions. Stakeholders can disagree over what should change and how success should be judged.
Distinguish project outputs such as buildings from outcomes such as access or affordable housing. Boundaries and baseline dates shape the assessment.
Worked example
A fictional scheme completes 500 homes. To assess affordability, examine prices, rents, incomes, tenure and access; completion alone cannot answer that question.
Common mistake: A developer’s stated aim is not independent evidence of success.
Ask what would have happened otherwise
Before-and-after change includes wider economic shifts and selection as well as the project. A counterfactual comparison estimates change without the intervention under justified assumptions.
Compare places carefully: unsuitable comparison areas can differ in trends or exposure. Qualitative accounts can reveal processes that aggregate data miss.
Worked example
Fictional employment rises 12 points in the project area and 7 in a comparison area. The difference in changes is 5 points, not proof of causation without credible comparability.
Common mistake: A numerical comparison does not remove all confounding.
Evaluate displacement and lasting outcomes
Rising values and investment can accompany displacement of residents or firms. Improved averages may partly reflect who moves in and who leaves.
Assess durability, maintenance and effects beyond the boundary. Urban and rural regeneration involve different service, housing and employment conditions.
Worked example
Fictional median income rises while the share of original residents falls from 80% to 50%. The data prompt a population-composition question rather than proving original residents gained income.
Common mistake: A better area average cannot establish benefit to the same people.
Try a different resource
Land-use maps
Classifications describe the mapped dominant land use in equal-area cells. They do not describe everyone who lives or works there.
Scroll the diagram sideways to see the full resource.
| Cell | Land use | Area (km²) |
|---|---|---|
| A1 | Housing | 1 |
| A2 | Green space | 1 |
| A3 | Housing | 1 |
| A4 | Housing | 1 |
| B1 | Transport | 1 |
| B2 | Industry | 1 |
| B3 | Green space | 1 |
| B4 | Industry | 1 |
| C1 | Green space | 1 |
| C2 | Transport | 1 |
| C3 | Industry | 1 |
| C4 | Housing | 1 |
| D1 | Housing | 1 |
| D2 | Green space | 1 |
| D3 | Green space | 1 |
| D4 | Industry | 1 |
Resource description
A1: Housing; A2: Green space; A3: Housing; A4: Housing; B1: Transport; B2: Industry; B3: Green space; B4: Industry; C1: Green space; C2: Transport; C3: Industry; C4: Housing; D1: Housing; D2: Green space; D3: Green space; D4: Industry. Every cell is 1 km².
Write an explanation
Check your answer
- Define stakeholder criteria and a project boundary.
- Compare outputs with outcomes.
- Examine attribution and displacement.
- Judge social, environmental and durable effects alongside economic change.
Practise and review a written answer
Case studies
Olympic Park regeneration in East London · Changing land use along Glasgow’s Clyde · Bristol’s clean air zone
These pages provide selected evidence. Check the whole case requirement with your teacher.
Read further
- qualifications.pearson.com — source or course reference
- www.aqa.org.uk — source or course reference
- www.aqa.org.uk — source or course reference
- www.ocr.org.uk — source or course reference
- www.eduqas.co.uk — source or course reference
Evaluating regeneration · Sampling and representativeness · Association and geographical explanations
Course links
AQA A-level Geography · Pearson Edexcel A-level Geography · OCR A-level Geography · Eduqas A-level Geography
Next topics
Changing places: meaning, evidence and connections · Urban growth and change
Selected teaching sequence with fictional worked data. The linked case records supply bounded evidence; they do not satisfy every course case requirement.