Changing places: meaning, evidence and connections
Combine quantitative change with lived experience and assess how representations shape place meanings.
A-level study: check your qualification and chosen options below.
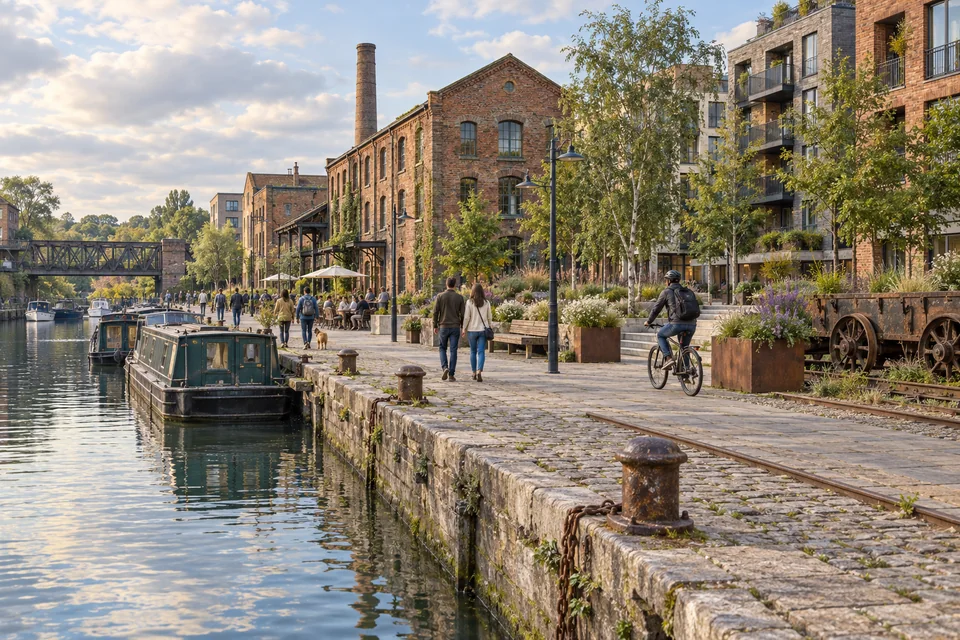
Explain place through relations
Place involves location, material conditions and meanings people attach to it. Endogenous features and connections elsewhere interact; a neighbourhood is shaped by both local experience and wider flows.
Insider and outsider categories are not fixed for every person. Age, length of residence, identity and activity can produce different experiences within the same place.
Worked example
A fictional former warehouse becomes housing. The land-use change is observable; whether it signifies improvement, exclusion or lost heritage requires people’s evidence.
Common mistake: A photograph cannot establish one shared place meaning.
Use representations as evidence
Statistics, maps, interviews, art and media represent places through choices of boundary, time and emphasis. A representation can reveal an actor’s aims without providing an unbiased description.
Triangulation compares evidence types and investigates disagreement. Count-based data and lived accounts are complementary when the question and sample are clear.
Worked example
A fictional advert shows one new square while survey accounts mention distant service loss. These describe different spaces and experiences; one need not invalidate the other.
Common mistake: An interview quotation does not represent all residents.
Compare a local and contrasting place
A meaningful comparison needs defined localities and a justified contrast. Economic structure, density, cultural context or political organisation can supply the contrast.
Trace continuity and change through connections, meanings and unequal influence. Whole-city intervention records can support a locality study but cannot replace it.
Worked example
Fictional locality A loses manufacturing while B gains logistics. Compare employment shares and lived accounts within consistent boundaries, then explain the wider connections behind change.
Common mistake: Choosing two city names does not establish a detailed contrasting-place study.
Try a different resource
Choosing a data representation
The task is to inspect association between two paired quantitative variables. Several displays can be useful for other purposes; choose the one matching this specific aim.
| Site | Distance (km) | Traffic count |
|---|---|---|
| A | 1 | 70 |
| B | 2 | 60 |
| C | 3 | 64 |
| D | 4 | 45 |
Resource description
Fictional representation exercise
Write an explanation
Check your answer
- Define two appropriate localities.
- Connect external flows to material change and meanings.
- Use quantitative and qualitative evidence critically.
- Evaluate internal characteristics and continuity alongside external influence.
Practise and review a written answer
Case studies
Changing land use along Glasgow’s Clyde · Olympic Park regeneration in East London
These pages provide selected evidence. Check the whole case requirement with your teacher.
Read further
- www.aqa.org.uk — source or course reference
- www.aqa.org.uk — source or course reference
- qualifications.pearson.com — source or course reference
- www.ocr.org.uk — source or course reference
- www.eduqas.co.uk — source or course reference
Matching evidence to a claim · Sampling and representativeness · Evaluating regeneration
Course links
AQA A-level Geography · Pearson Edexcel A-level Geography · OCR A-level Geography · Eduqas A-level Geography
Next topics
Regeneration: success for whom and compared with what? · Migration: flows, identities and uneven effects
Selected teaching sequence with fictional worked data. The linked case records supply bounded evidence; they do not satisfy every course case requirement.