Coasts: sediment, change and management
Explain sediment movement, measure coastal change and compare management choices.
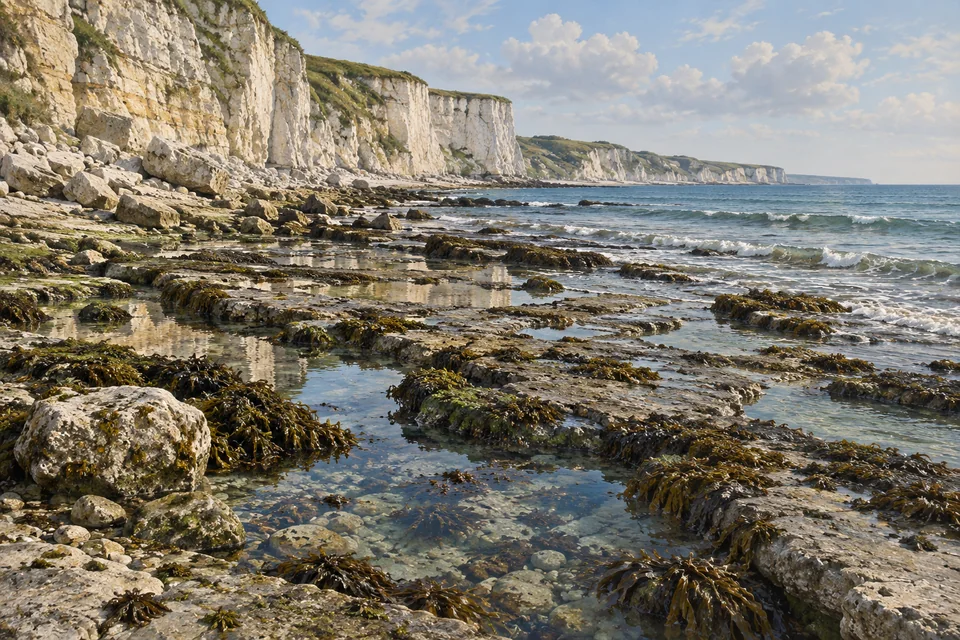
Explain movement along the shore
Waves, currents, weathering and mass movement affect coasts. Erosion removes material; transport moves it; deposition occurs when material settles. Rock type and structure influence resistance and failure.
Oblique waves can drive swash up a beach at an angle; gravity returns backwash down the slope. Repeated movement can transport sediment alongshore. Direction varies with wave conditions.
Worked example
In a fictional sediment budget, 120 units enter a beach compartment and 90 leave during a year. Net balance = +30 units. This records storage gain; it does not locate every grain or establish a measured shoreline advance.
Common mistake: A groyne can retain material locally while reducing supply farther along the coast. Local gain need not mean gain across the whole system.
Measure change carefully
Compare a coastline using a consistent baseline, location, scale and date. Tidal stage and seasonal beach movement can change an apparent shoreline. Cliff-top retreat and beach shoreline change are different measurements.
Worked example
A fictional cliff retreats 18 m between 2014 and 2026. Average rate = 18 ÷ 12 = 1.5 m/year. It need not retreat 1.5 m in each year; individual failures may account for much of the change.
Common mistake: An average historical rate is not a guaranteed forecast. Storms, defences and geological conditions can change.
Compare management choices
A sea wall, beach nourishment and managed realignment address different processes and land uses. Compare costs, maintenance, sediment effects, habitat and who gains or loses access.
Managed realignment changes the defended boundary and can create intertidal space. It involves decisions about the land allowed to flood and the land still protected.
Worked example
A fictional nourishment programme costs £2m initially and £0.4m at the end of each of five years. Undiscounted total = £4m. This comparison excludes inflation, financing and environmental outcomes, which need separate evidence.
Common mistake: The cheapest cash cost is not automatically the best geographical choice.
Try a fresh resource
Coastal change rates
Both surveys use the same defined cliff-top line and coordinate system. Movement is a net landward change over the whole period.
| Record | Value |
|---|---|
| Initial survey year | 2000 |
| Final survey year | 2015 |
| Landward movement of the same cliff-top line (m) | 30 |
Resource description
Fictional repeated cliff-top surveys
Explore the process
Use sourced case evidence
- Managed realignment at Medmerry
- Dawlish railway resilience
Managed realignment at Medmerry · Dawlish railway resilience