Carbon cycles: stocks, fluxes and changing feedbacks
Calculate carbon balances, explain fast and slow pathways, and evaluate coupled climate feedbacks.
A-level study: check your qualification and chosen options below.
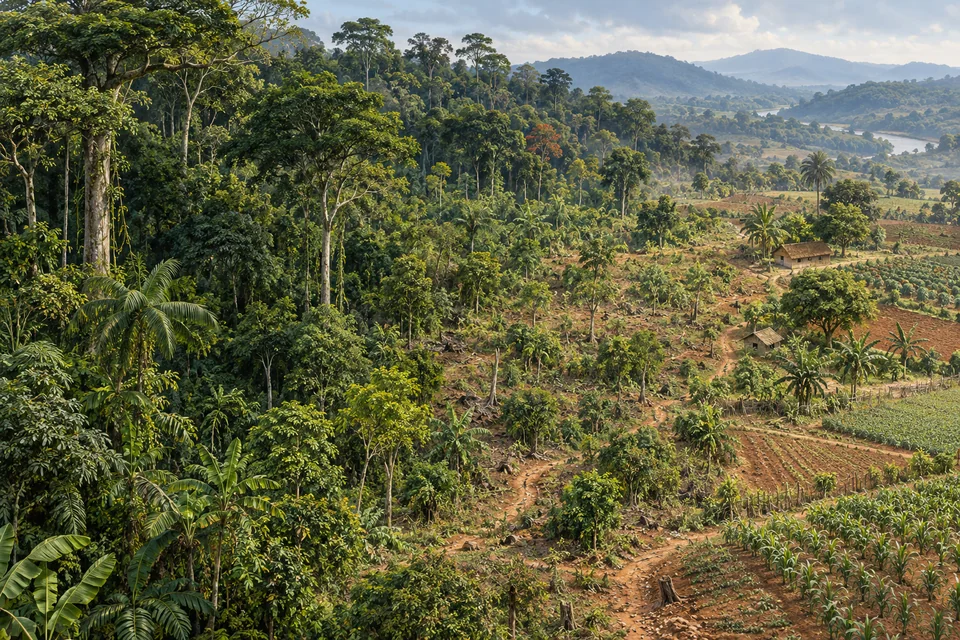
Distinguish a carbon stock from a flux
A stock is carbon held in a reservoir; a flux transfers carbon per unit time. Photosynthesis, respiration and decomposition exchange carbon among atmosphere, vegetation and soils.
Geological storage and weathering operate over longer timescales. Specify the boundary and period before deciding whether a system is a net sink or source.
Worked example
A fictional forest absorbs 12 tonnes C/year and releases 9 tonnes C/year across the stated boundary. Its net uptake is 3 tonnes C/year; its total stored carbon remains a different quantity.
Common mistake: A large forest stock does not demonstrate a large current net sink.
Explain land-use change through the system
Clearance can transfer biomass carbon through burning or decay and reduce future uptake. Soil responses depend on land use, disturbance and moisture.
Restoration can rebuild stores over time, but survival, fire, management and displaced land uses affect permanence. A planted area is not a measured carbon removal.
Worked example
A fictional stock falls from 100 to 70 tonnes C/ha on 200 ha: loss is 6,000 tonnes C. The data do not show how much entered the atmosphere, products or another store.
Common mistake: Stock loss and atmospheric emissions need matching boundaries.
Reason through a climate–carbon feedback
Warming can influence decomposition, fire and frozen-ground carbon, which can change atmospheric greenhouse gases and further affect climate. These pathways have different speeds and uncertainties.
Additional carbon dioxide can also influence uptake, constrained by nutrients, water and disturbance. Evaluate competing processes instead of treating every feedback as the same response.
Worked example
A fictional warming perturbation adds 2 units of release and 1 unit of additional uptake per year. The net +1 atmospheric transfer amplifies the original change within this simplified boundary.
Common mistake: Positive feedback means amplification, not a beneficial outcome.
Try a different resource
Time series and missing observations
The same river level threshold is used throughout. One annual record is missing. Line segments only connect consecutive observed years; no zero or interpolated observation has been inserted.
Scroll the diagram sideways to see the full resource.
| Year | Days above the fixed level |
|---|---|
| 2018 | 29 |
| 2019 | 36 |
| 2020 | 25 |
| 2021 | 38 |
| 2022 | Missing |
| 2023 | 33 |
| 2024 | 26 |
| 2025 | 31 |
Resource description
Exact observations: 2018: 29 days; 2019: 36 days; 2020: 25 days; 2021: 38 days; 2022: missing days; 2023: 33 days; 2024: 26 days; 2025: 31 days. The line is deliberately broken at the missing year.
Write an explanation
Check your answer
- Use stocks and fluxes with correct units.
- Connect fast and slow pathways.
- Analyse an amplifying or damping feedback.
- Evaluate permanence, scale and uncertainty of management.
Practise and review a written answer
Case studies
Amazon forest conversion · Forest and plantations in Kalimantan · Permafrost thaw and Denali’s park road
These pages provide selected evidence. Check the whole case requirement with your teacher.
Read further
- www.ipcc.ch — source or course reference
- www.aqa.org.uk — source or course reference
- www.aqa.org.uk — source or course reference
- qualifications.pearson.com — source or course reference
- www.ocr.org.uk — source or course reference
- www.eduqas.co.uk — source or course reference
Forest conversion and distant demand · Ecosystem interdependence · Power, energy and reliable supply
Course links
AQA A-level Geography · Pearson Edexcel A-level Geography · OCR A-level Geography · Eduqas A-level Geography
Next topics
Climate change: evidence, causes and responses · Water cycles: budgets, residence time and feedback
Selected teaching sequence with fictional worked data. The linked case records supply bounded evidence; they do not satisfy every course case requirement.